|
Home Depot Report Roof Top Unit (RTU) Subcooling Test |
|
----- Original Message ----- From: Rick Bofinger To: 'Matt Ross' Cc: 'MacWord' Sent: Wednesday, September 10, 2008 11:08 AM Subject: Demand Buster Dear Matt: We are a mechanical contractor in Northern California that uses a number of techniques to reduce energy use. We recently completed a test of the Thermal Flow “Demand Buster” cooling tower on a Home Depot. I am attaching a report that is getting a lot of notice. We achieved a 28.9% reduction in peak demand, and a 55% reduction in kWh, while actually INCREASING the capacity of the a/c unit.
We were able to retrofit and downsize the compressors due to the increased cooling capacity created by the Thermal Flow Demand Buster addition, but we estimate that 75% of the energy savings would have been achieved with the Demand Buster alone.
We have also used this product on low temp refrigeration systems with excellent results. I am attaching the Home Depot report for your consideration, as well as a couple of pictures of the installation.
Two compressors operation is indicated by the thick lines in the bottom chart running from about 15 to 28 on red and 13 to 19 on green. You can notice the dropping out of the second stage compressor by the thick vertical lines. The elevated thin green line in day two indicates stage two was required more constantly. The taller lines indicate a compressor coming on or dropping off. All these charts were pulled from raw data, there are NO interpretive calculations used.
Rick Bofinger Jerico Mechanical |
|
The charts below show energy savings achieved at a national big box retail store.
Peak reduction was 28.9% kWh reduction was in excess of 50%
The data we collected was reviewed by Optimized Energy, a Roseville Electric sub contractor. I would like to take this opportunity to review the attached charts and to explain what they can tell us about the performance of the air conditioner upgrades we implemented.
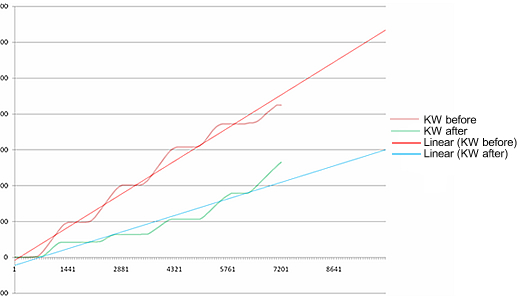
Linear Chart
The linear chart (straight and wavy lines inclining to the right) shows the accumulation of kWh as the system ran for 5 days during average to hot weather. Our summer has been very mild this year and so it is a conservative baseline to use for extrapolating future performance. 5 Days kW Accumulation
Numbers across bottom are minutes (1440=1 day)
1. The red line (pre-retrofit data) shows the outside temperatures during the unseasonably warm weather that we experienced in May 2008. The post retrofit data (blue lines) was measured in July. The hottest pre-retrofit day was 100.7 degrees on the roof, the hottest post retrofit day was 107.0 on the roof. 2. If you follow the trend out to 7 days, the energy saved was in excess of 50%. Based on Roseville electric's numbers, this store spent $172,804 on power in 2007, and $200,590 the previous year which was a hotter summer. Since we demonstrated a reduction in demand of 28.9% and kWh by over 50%, we anticipate that we can similarly reduce the store's total electrical cost in proportion to the amount of cooling energy consumed by the store. Cooling energy costs typically account for 20 to 40 percent of the electricity costs for retail stores. Assuming this store consumes 30 percent of its overall energy bill for cooling, the savings per year would be on the order of $53,000 per year. Actual savings are likely to be greater because the concentration of savings during the peak summer rate period and the associated reduction in peak kW demand will lower electricity costs in an amount greater than the percentage reduction in kWh. In other words, a 50 percent reduction in kWh will translate to greater than 50 percent reduction in energy costs because of the reduction in demand and time of use charges. To better refine this estimate we would need to use data loggers to measure the amount of power used throughout the building such as lighting, equipment, etc. over a long period of time. These efforts are likely to improve the savings estimates by a factor of 20 to 30 percent. Meanwhile, you are missing the opportunity to capture substantial cost savings while the air conditioner upgrade waits for the results of the data logging exercise. 3. The horizontal runs on the wavy lines indicate the unit running in economy mode with no compressors, just pulling in outdoor air at cool periods, and confirms proper operation of economizers.
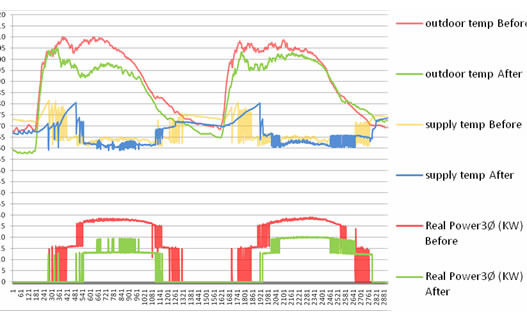
Temp/Power Comparison Chart
This chart shows two hot days temperature (about 100 degrees). Reds and yellow are before retrofit, green and blue are after. The legend to the left accurately defines temperature at the top of the chart and power at the bottom of the chart. The bottom chart shows run time and cumulative power consumed in kW over the course of five days.
Two Day Before Retrofit & Two Day After Retrofit Comparison
The top blue line on top indicates that we maintained a lower supply/discharge air temperature. The bottom green line indicates that we used substantially less energy to accomplish that work. The bottom chart shows peak energy used, and the staging of the two compressors. Two compressors operation is indicated by the thick lines in the bottom chart running from about 15 to 28 on red and 13 to 19 on green. You can notice the dropping out of the second stage compressor by the thick vertical lines. The elevated thin green line in day two indicates stage two was required more constantly. The taller lines indicate a compressor coming on or dropping off. All these charts were pulled from raw data, there are NO interpretive calculations used.
These data show that the retrofit will reliably provide improved comfort at lower overall cost.
Bear in mind that we can achieve these same savings on 30 year old equipment without having to change it out completely. On stores with older equipment you will recognize a greater energy reduction (20 to 30 percent greater) since the old units that are so prolific have reciprocating piston compressors (1.5 kW per ton) that we would change out to more efficient scroll compressors (0.88 kW per ton). As long as the air handler section is in good condition, which is usually the case, there is no need to change the entire unit to get energy savings. If the fan motor needs replacement this too can be accomplished without replacing the entire rooftop unit and when using an ECM or VFD-driven premium efficiency motor, can capture additional energy savings by directly controlling the fan speed to better match the cooling loads of the building on a moment-to-moment basis. This also further improves comfort by reducing the cycling of the compressor and maintaining a constant supply air temperature. |